


























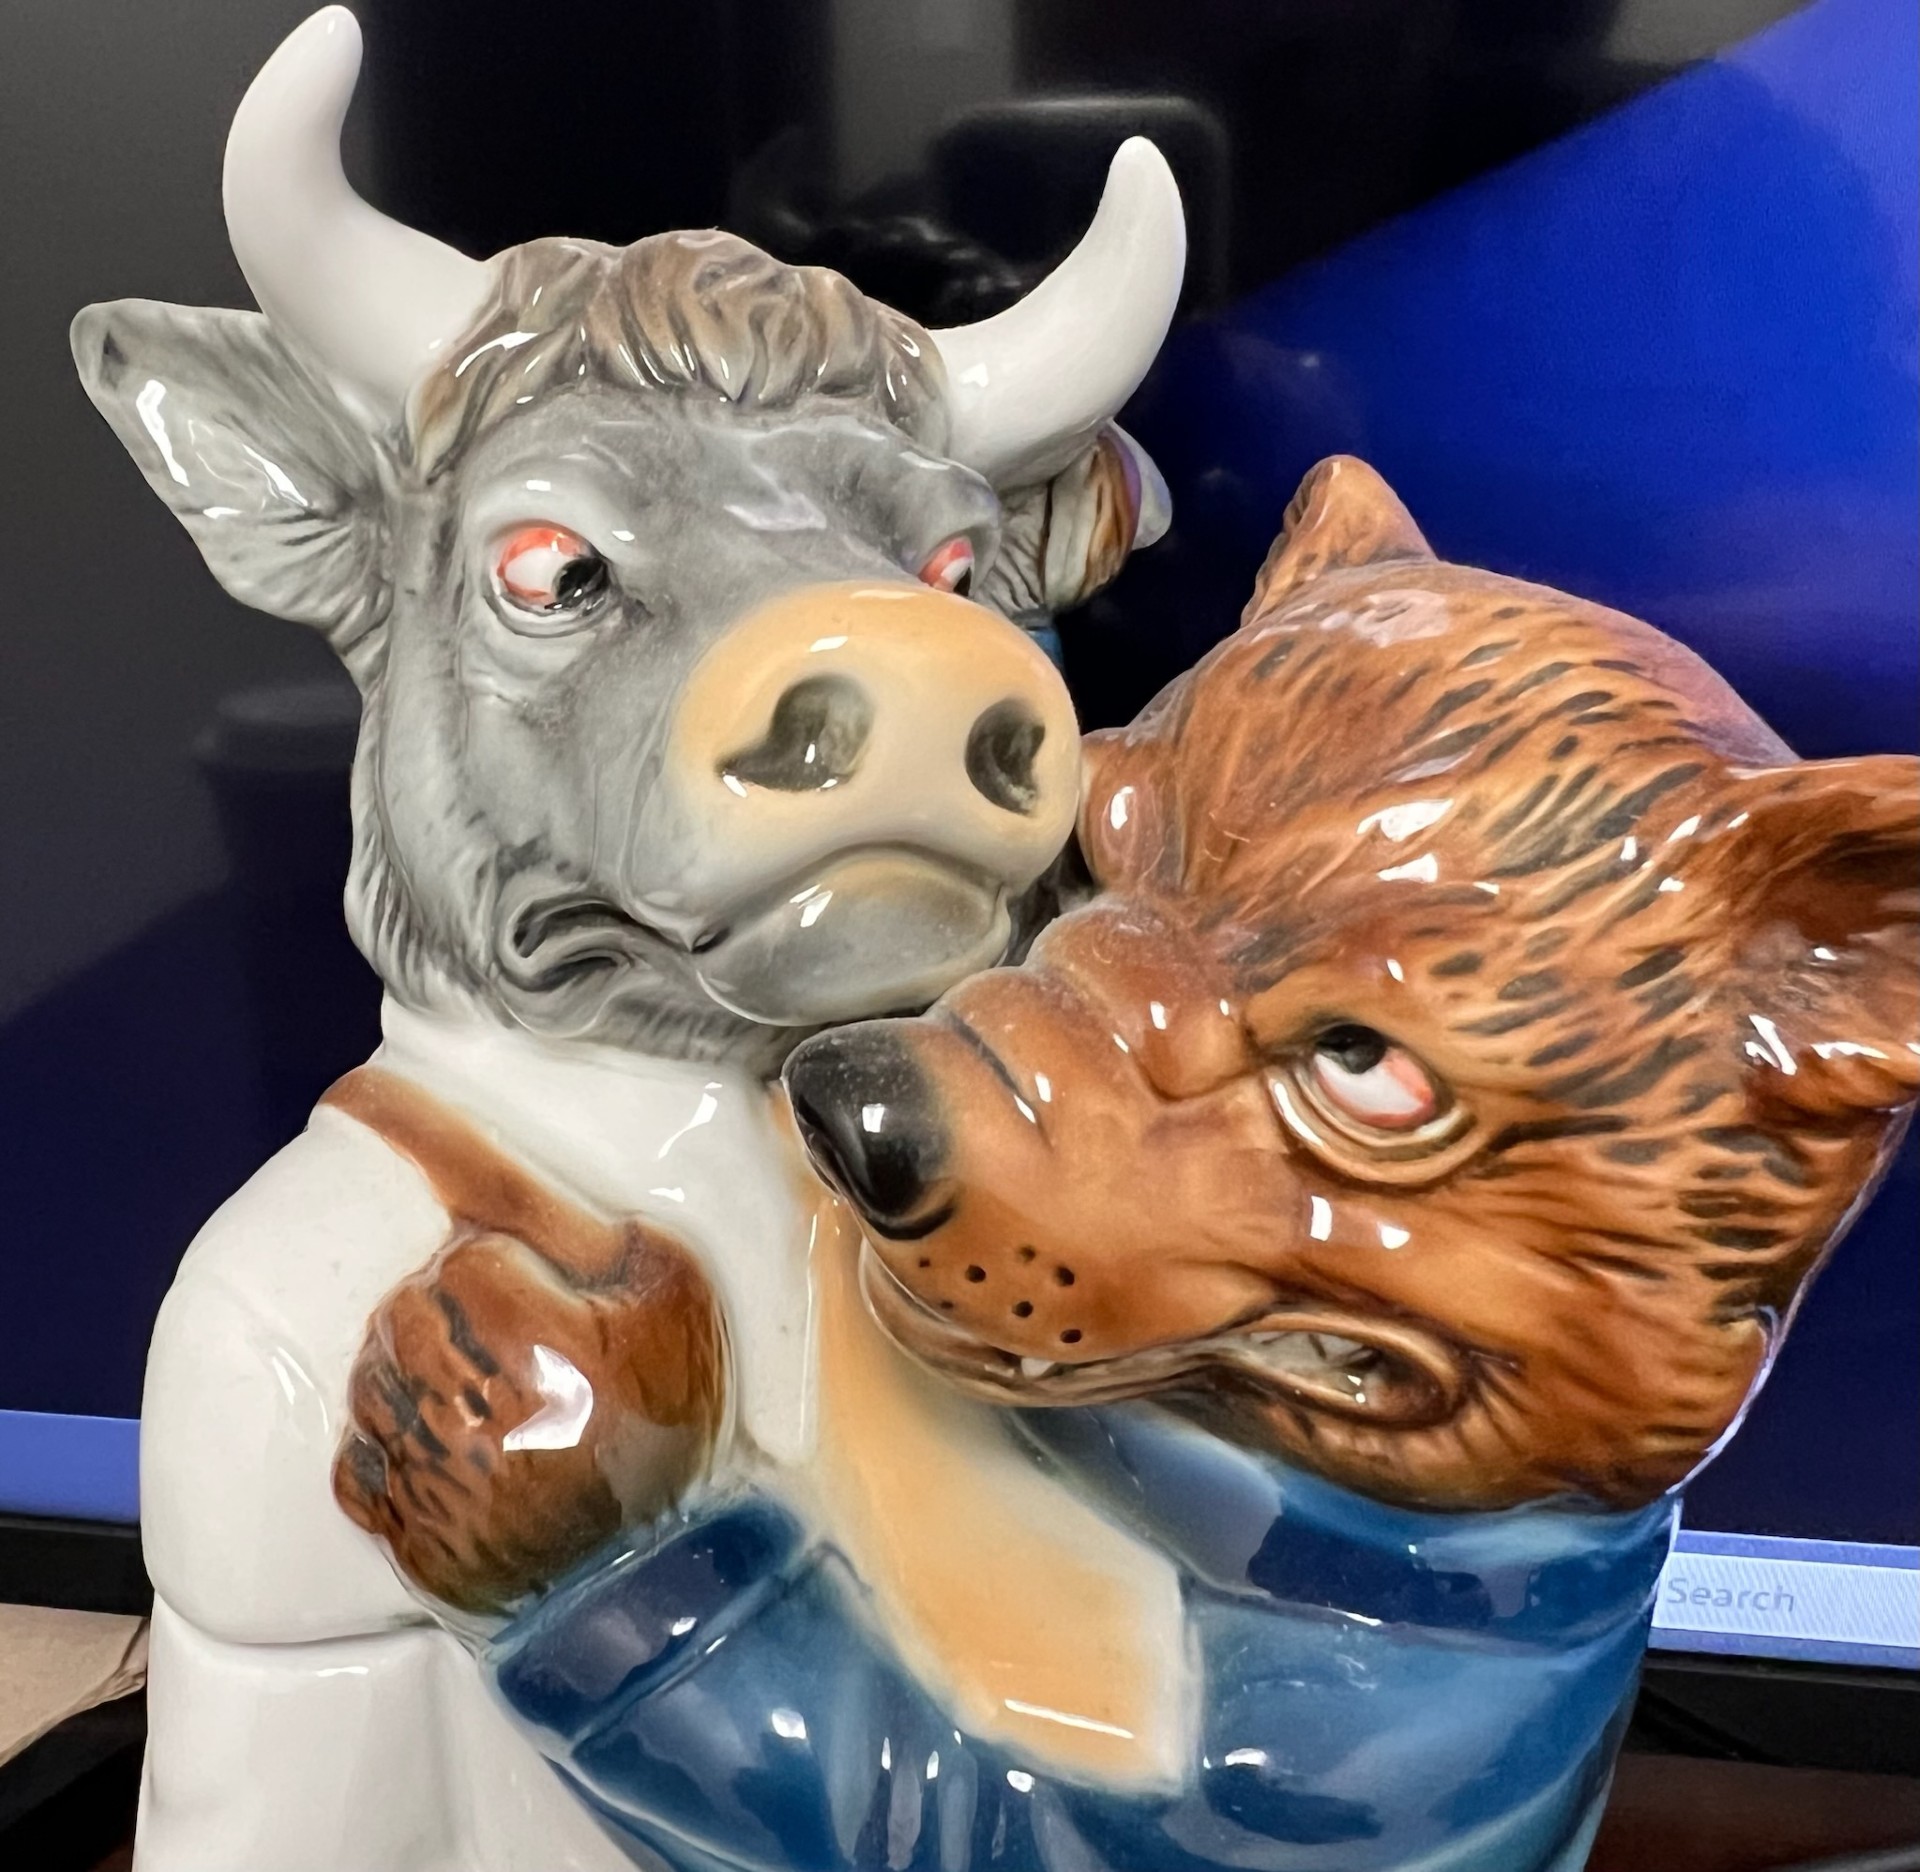
Some investors start scratching their heads when everyone is bullish and the market is at all-time highs. After all, if everyone thinks the market is going higher and higher after all-time gains then maybe it’s time to get out. Identifying key bull-bear trends is used by contrarian investors who want to get in when everyone else wants out — or when to get out when everyone wants to stay long.
Investors should keep in mind that the S&P 500 just hit all-time highs yet again in 2026. At this time, the S&P 500 was up 13.3% year-to-date and it’s up 21.2% from a year ago. The Dow Jones Industrial Average is handily above the 53,000 level and the S&P 500 even went above 7,750.
Oggonomics is looking at two key indicators that would signal extreme bullishness. The first is market sentiment by actual investors. The second is the CBOE Volatility Index, or the VIX, now indicating that complacency is now alive and well.
A key mantra of Oggonomics should be pointed out here as a reminder — “Always a bull, you’re a fool! Always a bear, you’re broke!”
EXTREME BULLISH SENTIMENT
The latest “Flow Show” from BofA Securities showed a signal that those contrarian investors may want to look at. The BofA Bull & Bear Indicator has now risen to 9.7 from 9.4, signaling an extreme bullishness. If you want to see just “how bullish” this is — BofA showed this 9.7 reading is the highest since 2021 back in 2021. A chart reading has been shown from BofA’s August 2026 report below:
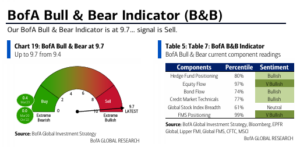
BofA’s private clients’ data are the source for the Bull & Bear Indicator. The group’s $4.5 trillion in assets under management was last seen with allocations of 65.7% stocks, 17.4% bonds and 9.6% cash. It also showed a rotation out of Treasury notes into Treasury Bills but also showed investors were adding more into stocks. The aggregate of the private clients was shown to be buyers of municipal bonds, Japan and staples. They were net sellers of volatility, utilities, and emerging market debt.
Michael Hartnett, BofA’s investment strategist, and his team believe the flows remain “in summer Retreat/Rotate not Reload camp” and the team is recommending for its clients to retreat out of risk assets and/or rotate into:
- some defensive positions (noting “staples”),
- duration (REITs, small cap, biotech),
- and the U.S. dollar.
BofA’s view here is that these are all protected from ongoing tightening of financial conditions, are less cyclically vulnerable than banks, industrials, semiconductors. All in, the Flow Show indicated that asset allocation remains “long stocks, short bonds” and noted a perception that the equity market is in a “too big to fail” view. With the economy dependent on the wealth effect, household equity holdings were up $7 trillion YTD — following $9 trillion in gains 2025 and 2024. The report also showed that the AI data-center capex boom was driving wealth.
WHAT ABOUT THAT VOLATILITY THINGIE?
The CBOE Volatility Index (the VIX) is currently down around 15. As volatility goes lower, it is generally after stocks rise without any serious pullbacks. And as volatility stays low, it generally signals that investors are not that worried about that market. It also means that buying market protection via put options is generally quite cheap to purchase.
As of August 7, the VIX closed at 14.90. Any VIX readings under 15 signal complacency and that investors feel everything is “safe” at the moment. That close under 15 was the first reading since the 14.49 closing price on January 9, 2026. Just be advised that there were 11 consecutive days where the VIX was under 15, and it did close as low as 13.49 in late-December (2025).
A 1-year VIX chart has been provided below, courtesy of stockcharts.com:
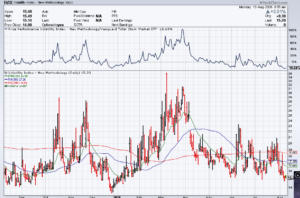
The VIX is just one tool to consider in extreme readings. There is also no reason to believe that any crash or big correction has to be in the cards immediately. Markets can remain overbought or signal extreme complacency for quite some time.
SHOULD INVESTORS PANIC?
Every investor should know that sentiment can remain strong for extended periods. And they should know that volatility can (and has) remained low for extended periods of time. Reversing bullishness and sentiment often requires an outside event that was unforeseen to reverse those two scenarios — it is rarely just a result of profit taking after big gains.
Investors don’t have to panic just because “things look good and feel safe” at any point in time. Good times can stay good for a long period of time. And never forget that the best decisions are rarely made in a state of panic.
STRATEGIES TO CONSIDER NOW
If investors worry about too much bullishness and too much complacency, they don’t have to hit the exit button out of every risk asset like stocks. Exiting all positions at once can create significant tax issues that have to be paid. It can also interrupt long-term investment plans that have been in place and that are in place with a view for years into the future.
One simple strategy that investors can choose is buying longer term put options. Buying short-dated options over and over during a market rally may just result in erosion of gains as the options keep expiring. And don’t forget that probably 99% of investors are not exactly good at picking exact top and bottoms. By adding in longer-dated options from time to time as a hedge, it just gives those investors a hedge against an unforeseen market correction beyond a week or two (or days). And buying protection via put options is currently quite cheap.
Another strategy investors can consider is “trimming” gains by selling a portion of their stocks rather than hitting a mass exit. Market rallies can go on for weeks, months or even years, sometimes without even seeing serious corrections other than overbought sell-offs and due to technical readings signaling it’s time to lock in some gains.
A third strategy investors can use is similar to what BofA’s “rotation” noted above. Exiting or trimming some of the riskier stocks and rotating into defensive sectors like staples and utilities (or other safe dividend payers) is often used when bullish sentiment and extreme complacency are present.
YES, THERE ARE OTHER CONSIDERATIONS
Be advised that this reporting includes just two observations happening simultaneously at the start of August 2026. There are many other technical indicators and valuation metrics that investors may also want to take into consideration before deciding to exit, trim, hold or even add into positions.
This reporting also skipped over some of the issues like geopolitics and ongoing armed conflicts, softer economic readings, interest rate fears and even national elections. It also ignores valuation analysis for individual stocks and sectors — and not every sector is showing extreme valuations at this time.
It’s now cheaper to buy market protection that it has been in quite some time. Stocks are at all-time highs at a time when some investors continue to have worries about higher interest rates and have other fears from within and outside of the United States.
This reporting should also not be interpreted as any advance or extreme warning that ominous days are ahead. And any strategies you choose should be made with the help of a financial advisor.